As of March, the total net loss of jobs in the United States during the official recession of 2008-2009 was finally made up. The graph below says it all:
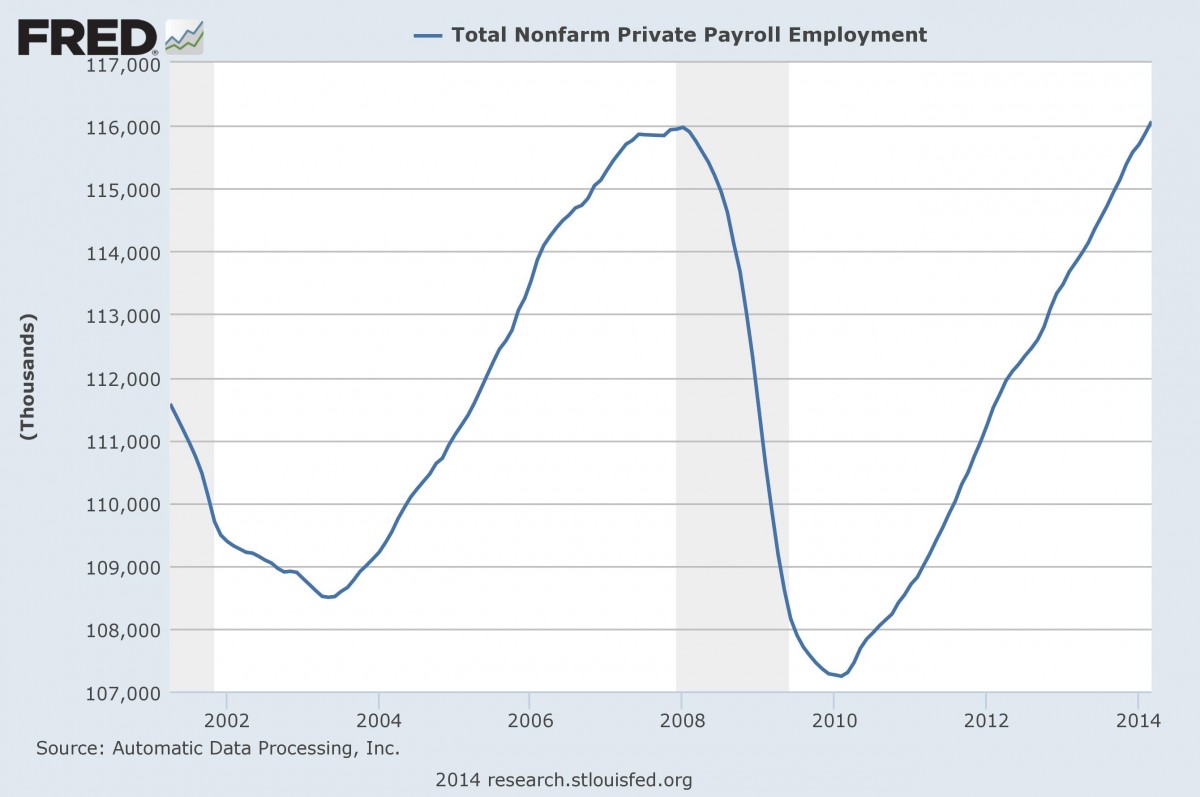
The total number of jobs in the U.S. stood at 116.0 million in January 2008, then fell to 107.2 million by February 2010. The net loss of 8.8 million jobs was finally regained in March 2014, when the jobs total hit 116.1 million, including 491,000 gained so far this year. It’s a major milestone, but not quite reason to celebrate.
According to the same report, 10.5 million people are still out of work and the headline unemployment rate remains at 6.7 percent. If you count those who have given up looking for work or have only part-time hours despite trying for full-time, 12.8 percent are unemployed (the “U6” unemployment rate).
Just a few days before the Bureau of Labor Statistics revealed its report, Federal Reserve Chair Janet Yellen said, “The Federal Reserve has taken extraordinary steps since the onset of the financial crisis to spur economic activity and create jobs, and … those efforts are still needed.”
Why are we still short so many jobs? Despite being the peak, January 2008 was not perfectly rosy. There were still 7.7 million people unemployed then, with an unemployment rate of 5 percent. The 2.8 million additional unemployed today represent the growth in the labor pool — primarily young people looking for work.
The net gain of 192,000 jobs in March impressed investors, however.

“It is strong enough to indicate the economy is back on track, but not so robust that the Federal Reserve would have to start thinking about actually raising rates,” said Joel Naroff, head of Naroff Economic Advisors.
Yellen’s commitment to jobs is on the minds of investors watching these reports closely.
“As the speed of improvement in the labor market continues, all the things she’s looking at are going to get better,” said Neil Dutta, head of U.S. economics at Renaissance Macro Research LLC. “Economic conditions continue to improve.”
At this rate, it will take just over a year to rebound to the same number of unemployed workers we had at the start of 2008.
This is still an important milestone, especially given fears that job growth had slowed during the winter months. Statistical anomalies and bad weather were the main reasons for those weak numbers after all, and there is reason to be hopeful.
The rollercoaster of employment has brought quite a few changes over the last six years, however. While the total number of jobs may be back to where it was in 2008, the mix has changed slightly. The table below shows employment in broad categories at key points in the ride. These are the previous peak at the start of 2008, the valley in January 2010 and at the start of 2014, the period for which the most recent information in available. Data comes from the Bureau of Labor Statistics’ Current Employment Database.
|
Employment (thousands) |
2008 |
2010 |
Net % |
2014 |
Net % |
Net # |
|
Total nonfarm |
138350 |
129687 |
-6.3% |
137386 |
-0.7% |
-964 |
|
Mining and logging |
740 |
663 |
-10.4% |
883 |
19.3% |
143 |
|
Construction |
7490 |
5654 |
-24.5% |
5874 |
-21.6% |
-1616 |
|
Manufacturing |
13746 |
11477 |
-16.5% |
12054 |
-12.3% |
-1692 |
|
Trade, transportation, and utilities |
26714 |
24473 |
-8.4% |
26172 |
-2.0% |
-542 |
|
Information |
3024 |
2744 |
-9.3% |
2679 |
-11.4% |
-345 |
|
Financial Services |
8282 |
7743 |
-6.5% |
7902 |
-4.6% |
-380 |
|
Professional & business services |
18051 |
16475 |
-8.7% |
18830 |
4.3% |
779 |
|
Education and Health Services |
18861 |
19712 |
4.5% |
21233 |
12.6% |
2372 |
|
Leisure and hospitality |
13550 |
12944 |
-4.5% |
14437 |
6.5% |
887 |
|
Other services |
5516 |
5320 |
-3.6% |
5480 |
-0.7% |
-36 |
|
Government |
22376 |
22482 |
0.5% |
21842 |
-2.4% |
-534 |
At the bottom in 2010, the biggest losses were in construction and manufacturing. Roughly a quarter of all construction jobs and one-sixth of all manufacturing jobs were lost in that two-year stretch. One category — health care — actually gained workers when every other area was losing.
Now that we are back to even overall, the biggest net losses remaining are in construction, which is still down 22 percent of its jobs, or 1.6 million, and manufacturing, still down 12 percent, or 1.7 million.
Meanwhile, health care and the hospitality industry posted the largest net gains during the last four years.
While we may have returned to the same number of jobs overall, the construction and manufacturing sectors are still very weak. That is not good news for today’s workers.
According to a Department of Commerce report from last year, “Manufacturing jobs are often cited as good jobs: they pay well, provide good benefits, and manufacturing workers are less likely to quit than workers in other private sector industries.”
“On average, hourly wages and salaries for manufacturing jobs were $29.75 an hour in 2010 compared to $27.47 an hour for non-manufacturing jobs. Total hourly compensation, which includes employer-provided benefits, was $38.27 for workers in manufacturing,” the report demonstrated.
The net increase in jobs relating to health care and hospitality are due to the aging baby boomer population, many of whom are starting to retire, opening up new opportunities. The Bureau of Labor Statistics performed an analysis of health care jobs in 2013 and concluded that they will continue to expand. “The aging of the population is the primary contributor,” said BLS economist Michael Wolf, a co-author of the forecast.
With all of the qualifiers, however, reaching a new high in employment is still important. Between the relatively robust growth that we continue to see in jobs and the projected wave of retirement, we should see a significant change in the economy sometime in the next three years. But the loss of the best paying jobs for the working class is still a grave concern.
For now, it is better to be back to even on jobs than to still be behind. Fed Chair Yellen will continue to watch the progress of jobs and has pledged to continue to provide a strong stimulus until we reach a much more “normal” level of unemployment — something that could come as soon as a year from now.